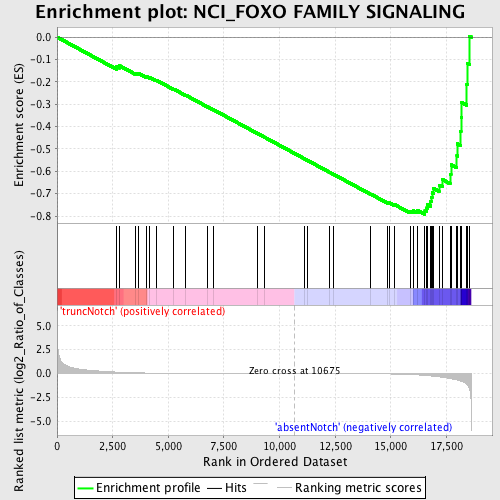
Profile of the Running ES Score & Positions of GeneSet Members on the Rank Ordered List
| Dataset | Set_03_absentNotch_versus_truncNotch.phenotype_absentNotch_versus_truncNotch.cls #truncNotch_versus_absentNotch |
| Phenotype | phenotype_absentNotch_versus_truncNotch.cls#truncNotch_versus_absentNotch |
| Upregulated in class | absentNotch |
| GeneSet | NCI_FOXO FAMILY SIGNALING |
| Enrichment Score (ES) | -0.7929156 |
| Normalized Enrichment Score (NES) | -1.7349763 |
| Nominal p-value | 0.0 |
| FDR q-value | 0.035915196 |
| FWER p-Value | 0.029 |
| PROBE | DESCRIPTION (from dataset) | GENE SYMBOL | GENE_TITLE | RANK IN GENE LIST | RANK METRIC SCORE | RUNNING ES | CORE ENRICHMENT | |
|---|---|---|---|---|---|---|---|---|
| 1 | RALB | 6130397 | 2681 | 0.149 | -0.1322 | No | ||
| 2 | CSNK1D | 4280280 4480167 6450600 | 2795 | 0.134 | -0.1273 | No | ||
| 3 | CDKN1B | 3800025 6450044 | 3544 | 0.076 | -0.1614 | No | ||
| 4 | CSNK1G1 | 840082 1230575 3940647 | 3660 | 0.069 | -0.1619 | No | ||
| 5 | SOD2 | 1410053 | 4035 | 0.055 | -0.1775 | No | ||
| 6 | GADD45A | 2900717 | 4152 | 0.051 | -0.1795 | No | ||
| 7 | G6PC | 430093 | 4461 | 0.043 | -0.1926 | No | ||
| 8 | FOXO3 | 2510484 4480451 | 5236 | 0.028 | -0.2320 | No | ||
| 9 | PLK1 | 1780369 2640121 | 5767 | 0.021 | -0.2588 | No | ||
| 10 | SFN | 6290301 7510608 | 6773 | 0.013 | -0.3119 | No | ||
| 11 | MST1 | 1400403 | 7036 | 0.011 | -0.3250 | No | ||
| 12 | RAN | 2260446 4590647 | 8989 | 0.004 | -0.4298 | No | ||
| 13 | CAT | 4280152 | 9338 | 0.003 | -0.4482 | No | ||
| 14 | XPO1 | 540707 | 11119 | -0.001 | -0.5440 | No | ||
| 15 | AKT1 | 5290746 | 11232 | -0.001 | -0.5499 | No | ||
| 16 | ZFAND5 | 6770673 | 12263 | -0.005 | -0.6050 | No | ||
| 17 | FASLG | 2810044 | 12413 | -0.005 | -0.6126 | No | ||
| 18 | CSNK1A1 | 2340427 | 14088 | -0.017 | -0.7013 | No | ||
| 19 | YWHAH | 1660133 2810053 | 14871 | -0.038 | -0.7403 | No | ||
| 20 | RBL2 | 580446 1400670 | 14929 | -0.040 | -0.7401 | No | ||
| 21 | MAPK9 | 2060273 3780209 4070397 | 15149 | -0.051 | -0.7477 | No | ||
| 22 | FBXO32 | 110037 610750 | 15862 | -0.101 | -0.7778 | Yes | ||
| 23 | IKBKB | 6840072 | 16012 | -0.118 | -0.7762 | Yes | ||
| 24 | YWHAE | 5310435 | 16190 | -0.138 | -0.7744 | Yes | ||
| 25 | YWHAZ | 1230717 | 16534 | -0.195 | -0.7770 | Yes | ||
| 26 | YWHAG | 3780341 | 16606 | -0.207 | -0.7638 | Yes | ||
| 27 | RALA | 2680471 | 16647 | -0.218 | -0.7482 | Yes | ||
| 28 | CSNK1G3 | 110450 | 16790 | -0.251 | -0.7352 | Yes | ||
| 29 | SIRT1 | 1190731 | 16815 | -0.257 | -0.7155 | Yes | ||
| 30 | MAPK10 | 6110193 | 16856 | -0.267 | -0.6959 | Yes | ||
| 31 | YWHAQ | 6760524 | 16921 | -0.282 | -0.6763 | Yes | ||
| 32 | BCL2L11 | 780044 4200601 | 17172 | -0.349 | -0.6612 | Yes | ||
| 33 | MAPK8 | 2640195 | 17325 | -0.395 | -0.6371 | Yes | ||
| 34 | CSNK1E | 2850347 5050093 6110301 | 17665 | -0.518 | -0.6129 | Yes | ||
| 35 | CREBBP | 5690035 7040050 | 17707 | -0.541 | -0.5709 | Yes | ||
| 36 | CHUK | 7050736 | 17970 | -0.662 | -0.5309 | Yes | ||
| 37 | USP7 | 3990356 | 17990 | -0.675 | -0.4767 | Yes | ||
| 38 | CSNK1G2 | 3060095 4730037 | 18124 | -0.763 | -0.4214 | Yes | ||
| 39 | SKP2 | 360711 380093 4810368 | 18157 | -0.799 | -0.3578 | Yes | ||
| 40 | CCNB1 | 4590433 4780372 | 18189 | -0.824 | -0.2921 | Yes | ||
| 41 | YWHAB | 1740176 | 18415 | -1.126 | -0.2121 | Yes | ||
| 42 | BCL6 | 940100 | 18435 | -1.170 | -0.1174 | Yes | ||
| 43 | CDK2 | 130484 2260301 4010088 5050110 | 18532 | -1.554 | 0.0045 | Yes |

